

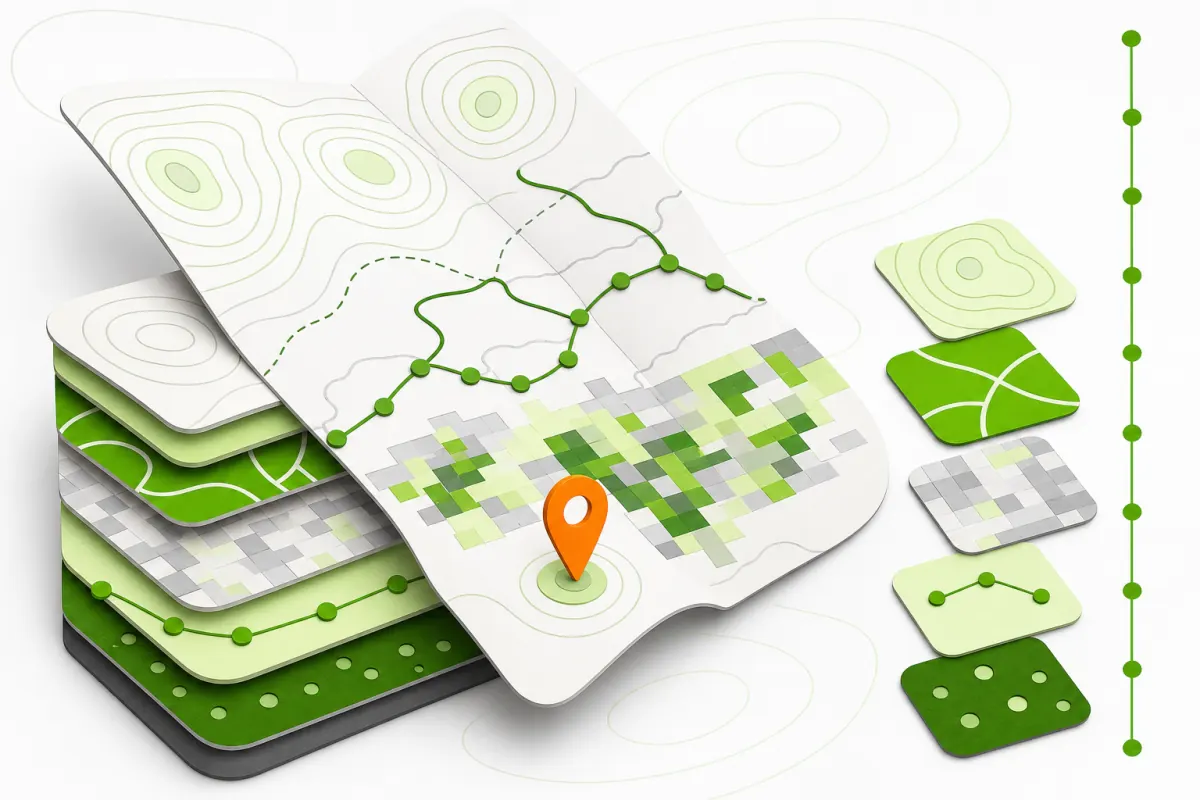
QGIS is an open-source desktop geographic information system for viewing, editing, analyzing, and presenting spatial data. A first project becomes easier when the interface is read as a set of connected layers: sources, coordinate systems, styling, processing, and output.
Open the Project With Its Coordinate Context
Every spatial layer needs a known coordinate reference system. QGIS can display layers with different systems in one project, but the source CRS must still be identified correctly. Check the layer properties before treating a visual mismatch as a data problem.
The project CRS determines how the map is displayed and affects measurements. Record that choice with the project so another person can reproduce the same geographic context.
It supports diverse data formats and coordinate systems while offering robust controls over layers and their properties. The platform’s flexibility makes it suitable for both simple mapping and complex spatial analysis. Data Visualization Tools: QGIS supports a wide range of data formats including shapefiles, GeoJSON, and raster images. Visualization capabilities include symbology options like graduated colors, categorized styles, and rule-based rendering. Users can apply complex styles to features based on attributes, enhancing map clarity. Charts and labels can be added directly on the map, with options for placement, font, and formatting. QGIS allows for dynamic visualization through data-defined overrides, letting symbols and colors change based on underlying data.
Organize Vector, Raster, and Database Layers
Vector layers store points, lines, or polygons and their attributes. Raster layers store values in cells. QGIS can also connect to spatial databases and web services, allowing a project to combine local and remote sources.
Use meaningful layer names and groups. Keep raw sources distinct from processed outputs, and inspect field types before joining tables or calculating values. A tidy layer panel is part of the analysis record.
Format choice affects how easily a project can be moved, audited, and edited. Common vector sources include Shapefile, GeoJSON, KML, and GeoPackage, while raster sources may arrive as imagery or gridded measurements. Database and web-service connections can keep larger or shared datasets outside the project file. Before converting anything, inspect geometry type, attribute fields, encoding, CRS, and whether the source is read-only. A conversion should have a stated reason—such as consolidating related layers or preserving longer field names—and its output should be checked against the source rather than assumed to be equivalent.
Style the Map as an Explanation
Symbology translates data into visual hierarchy. A single symbol can identify a category; graduated or categorized styles can reveal differences among features. Labels should remain legible and should not compete with the features they describe.
Color, line weight, and scale-dependent visibility should support the map’s question. Add complexity only when it communicates information that the reader needs.
Creating maps in QGIS involves detailed control over the appearance and behavior of layers, text, and final outputs. Users can customize how data is presented through various symbol settings, apply informative labels based on attribute data, and assemble map layouts suitable for sharing or printing. Symbology Options: QGIS offers extensive symbology choices for vector and raster layers. Users can select from simple symbols like points, lines, and polygons or use advanced options such as graduated, categorized, and rule-based styles to represent data attributes visually. A layer showing population density might use graduated color ramps, where darker shades indicate higher density. Users can also apply SVG or raster images as symbols for more complex representations.
Edit Features With Guardrails
QGIS provides tools for creating and modifying geometry and attributes. Snapping can align features to existing vertices or segments, while tracing can follow a known boundary. Topology checks can expose gaps, overlaps, or other geometry relationships that need review.
Save edits deliberately and keep a recoverable source copy. Attribute constraints and clear field definitions help prevent avoidable errors during repeated editing.
Users can manipulate geometries, control how features connect, and manage attribute data with precision. Feature Editing Tools: QGIS includes tools to create and edit features directly on the map canvas. Users can add points, lines, and polygons, as well as reshape existing geometries. The Advanced Digitizing Panel helps users draw with geometric constraints, improving accuracy. Undo and redo options enable easy correction of errors during editing sessions. Editing can be done on multiple layers simultaneously, provided they are in editable mode. Snapping and Tracing: Snapping ensures vertices or segments align correctly when adding or modifying features. To use QGIS effectively, start by exploring its core features and supported data formats.
Use Processing Tools as a Recorded Route
The processing toolbox includes operations for selection, buffering, overlay, geometry changes, raster calculation, and other spatial tasks. Each output should be tied to a clear question and a documented set of inputs.
For repeated work, batch processing, graphical models, or Python scripts can preserve the sequence. Automation is most reliable after the steps have been tested manually with representative data.
QGIS offers a wide range of geoprocessing tools designed to manipulate spatial data layers efficiently. Users can perform complex analyses to derive meaningful patterns, generate new datasets, and ensure the accuracy of their spatial data. Spatial Analysis Functions: QGIS supports numerous spatial analysis functions that help users examine relationships and patterns in geographic data. Buffering creates zones around features to study proximity, useful in environmental impact assessments or urban planning. Overlay tools like intersect, union, and difference combine or compare layers to produce new feature sets based on spatial relationships. Distance calculations enable measures between features, aiding in tasks like site selection or resource allocation.
Build a Complete Layout
A print layout brings the map frame together with a title, legend, scale information, and source notes where needed. Each element should help interpret the map. A legend does not need to repeat symbols that are already obvious, and a decorative north arrow does not correct an unsuitable projection.
Check the layout at its final size. Labels that look comfortable on a large monitor may become unreadable in the exported page.
These enable conditional changes in symbol appearance based on attributes, refining how data communicates its meaning on the map. Labeling Techniques: Labeling in QGIS relies on dynamic placement and styling that adapts to the underlying data. Labels can be created from any attribute field, formatted with custom fonts, sizes, and colors to improve readability and map clarity. The labeling engine supports features like buffer (outline) around text, shadowing, and blending to enhance visibility against complex backgrounds. Advanced settings allow expressions to customize label content, showing data-driven information like calculated values or concatenated fields.
Extend QGIS Carefully
Plugins can add specialized tools and connections. Install only what the project requires, review the plugin’s documentation, and record dependencies when a shared project relies on them. A missing plugin should not make the project’s core data impossible to understand.
Treat a plugin as a project dependency rather than a casual interface decoration. Identify the task it solves, read its documentation, and test it against a copy of representative data before making it part of a repeatable workflow. Record the plugin name and the role it performs so a collaborator can distinguish essential behavior from an optional convenience. If a workflow can be expressed with standard processing steps, a model, or a small transparent script, that route may be easier to preserve. Remove unused extensions and investigate compatibility in a controlled copy of the project when the application environment changes.
Follow a Beginner’s Map Route
Create a project and choose its coordinate reference system. Add one vector layer and inspect its attribute table. Add a raster or basemap for context. Apply a clear style and label a useful field. Run one processing operation and inspect the result. Compose and export a simple layout.
That small route touches the main parts of QGIS without turning the first map into a software tour. Once the data, CRS, analysis, and output are understood, additional tools can be added with purpose.
The beginner route is complete only when its coordinate assumptions are understood. Layers can appear aligned in the map canvas because the project transforms them for display, yet measurements and exported data still depend on correctly identified source systems. Check metadata instead of guessing from visual position, choose an appropriate project CRS for the area and task, and distinguish assigning a CRS from transforming coordinates into another one. Save those decisions with the project and include them in any handoff. A map that another person can reopen and interpret is more valuable than a dense tour of every available tool.