

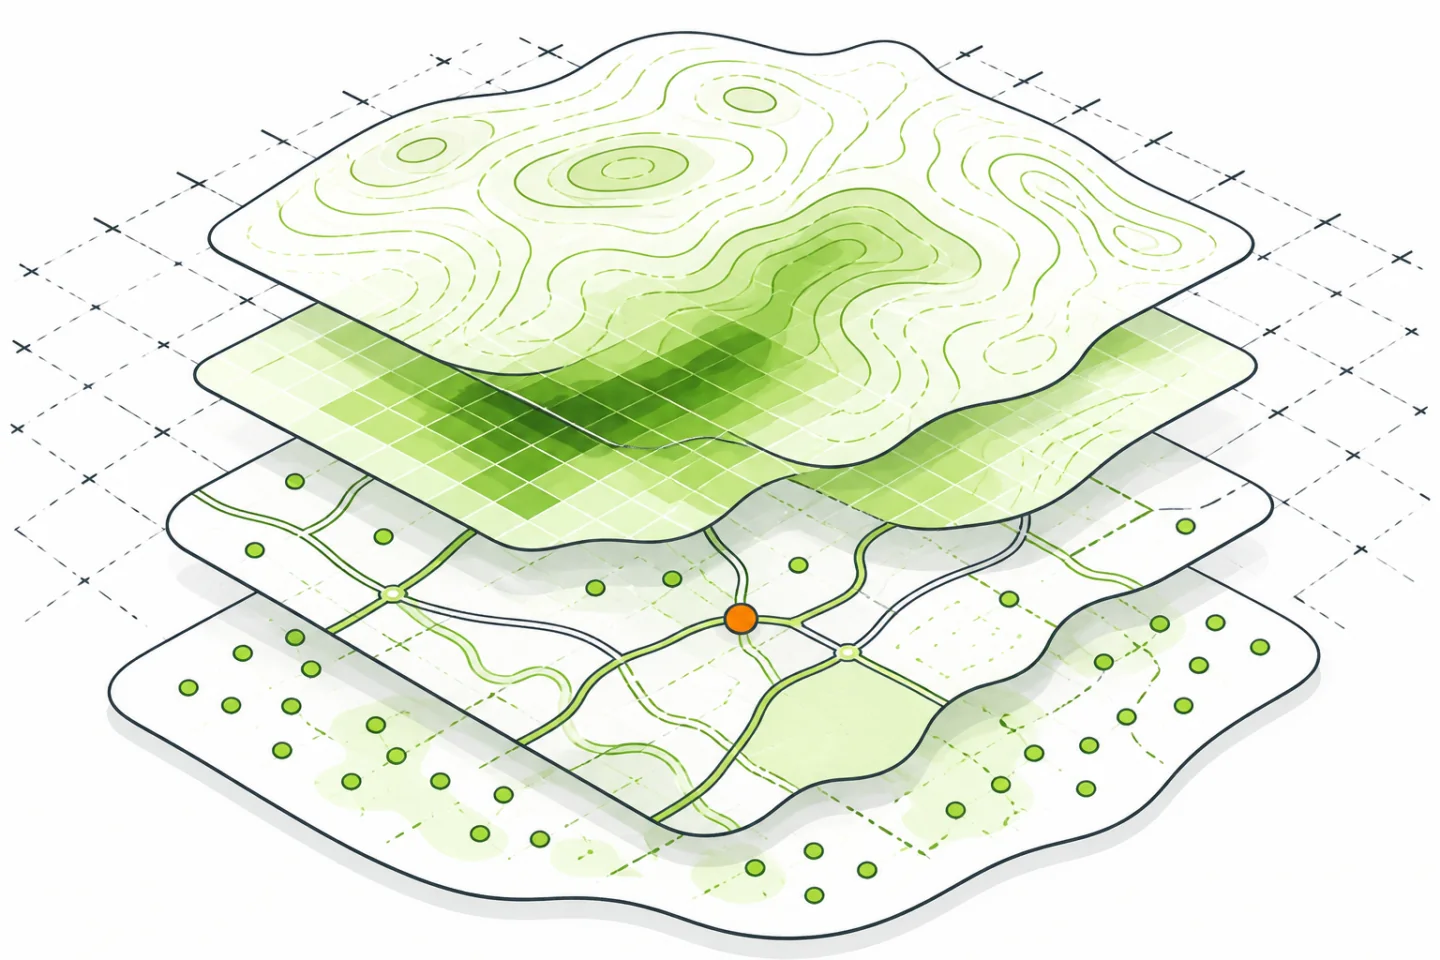
Mapping software turns location data into maps that can be inspected, edited, analysed and shared. It can combine addresses, boundaries, routes, measurements and field observations to answer practical questions: where assets are, how areas overlap, which places are nearest and what has changed.
The right choice depends less on the longest feature list than on the work people must complete. Before comparing tools, define the data, users, outputs and decisions involved. This keeps the evaluation focused and exposes requirements that a polished demonstration may hide.
Start with the data
Most mapping projects use three broad forms of data. Vector data represents distinct features as points, lines or polygons. A point might mark an inspection location, a line a road, and a polygon a service area. Raster data uses a grid of cells for imagery, elevation or other continuous surfaces. Tabular data holds attributes that can be joined to mapped features through a reliable identifier.
List every required input and output format before testing software. Include files received from partners, database connections, web services, printed layouts and exports used by other systems. A format appearing in an import menu is not enough: test whether field types, text encoding, geometry, metadata and null values survive a round trip.
Coordinate reference systems
A coordinate reference system defines how coordinates relate to places on Earth. Geographic systems commonly use latitude and longitude, while projected systems place the curved surface on a flat grid. A suitable local projection is usually needed for dependable distance and area measurements.
Record the reference system for every layer and check it on import. Software may reproject a layer for display, but it cannot repair coordinates stored under the wrong definition. If two layers fail to align, inspect their reference systems and source accuracy before moving features by hand.
Address and field records
Geocoding converts an address or place description into coordinates. Match quality depends on both the locator and the source record, so keep house number, street, locality, region and postal code in separate fields where possible. Review unmatched and low-confidence results instead of accepting them silently.
Field collection adds another set of constraints. Confirm whether users can work offline, capture the required attributes and coordinates, attach permitted evidence, and synchronise changes without overwriting approved records. Test the complete journey from collection to review rather than the mobile form alone.
Choose the working environment
Desktop software suits detailed editing, cartography, large local datasets and repeated spatial analysis. Browser-based software suits shared viewing, controlled publishing and access from managed accounts. Mobile software supports surveys, inspections and reference maps away from a desk. Many projects use all three, with clear responsibility for the authoritative data.
Decide where data will be stored and processed. Local files are simple for individual work but become difficult to govern when copied between people. A shared database or hosted service can improve access and consistency, but it introduces permissions, availability, backup and integration requirements.
Licensing is only one part of cost and control. Compare setup, training, support, storage, data transfer, maintenance and the effort needed to leave the system later. Check whether common formats can be exported without losing geometry or attributes. A small trial with representative data is more revealing than a generic comparison chart.
Evaluate the essential capabilities
Editing and validation
Editors should be able to create and modify features without damaging the original data. Look for field constraints, required values, controlled lists, geometry checks, duplicate detection and a review state for uncertain changes. In multi-user work, test conflict handling, permissions and edit history.
The necessary geospatial capabilities depend on the project. Common operations include buffering, clipping, dissolving, spatial joins, proximity searches and distance or area calculations. Each operation should show its inputs, units, reference system and output location so another analyst can reproduce it.
Map design and publishing
A map should make patterns legible without implying more certainty than the data supports. Test categories, graduated values, proportional symbols, labels, legends and scale-dependent visibility. Colours must remain distinguishable, labels should not obscure important features, and printed or exported layouts should retain their hierarchy.
For an interactive map, check layer controls, filters, search, pop-ups, keyboard use and small-screen behaviour. Show only fields that help the reader. Dense geometry may need generalising at small scales, while sensitive details may require aggregation or removal before publication.
Repeatable processing
Saved models and scripts are useful when the same steps recur. Automation should expose only the inputs a user must change, write outputs to a predictable location and stop clearly when validation fails. Keep the process under version control and test it on copies of important data.
Check interoperability and performance
Interoperability means more than opening a file. A dependable workflow preserves geometry types, attribute names, dates, encodings, reference systems and identifiers as data moves between tools. Test import, editing, export and re-import with difficult examples, including empty values, long text, non-ASCII characters and multipart geometry.
Web services can provide current map images or individual features without distributing local copies. Document authentication, supported reference systems, request limits, pagination and update frequency. Request only the necessary area, fields and records. Keep credentials outside project files and do not assume a visible web layer is editable.
Performance tests should use representative data and ordinary devices. Measure the time to open a project, draw a typical extent, filter records, run a common analysis and synchronise field edits. Also test failure conditions such as a slow connection, an unavailable service or a partially invalid file. The aim is not a single benchmark but a workflow that remains understandable under expected load.
Build a controlled workflow
Organise layers by purpose, such as reference, field collection, analysis and published output. Names should identify the subject, area and status without depending on the folder around them. Avoid labels such as “final” unless the team has defined what final means.
Maintain a short data dictionary for each important layer. Record its owner, authoritative location, reference system, update method, required fields, sensitivity and permitted use. Processing notes should explain transformations such as joins, simplification and aggregation. A documented GIS workflow management approach helps reviewers understand where data came from and who can approve changes.
Quality control
Check data when it enters the project, after significant processing and before publication. Useful checks include valid geometry, expected feature counts, unique identifiers, complete required fields, plausible coordinate ranges and correct units. Topology rules can flag gaps, overlaps or disconnected lines, but a person should decide whether each result is actually an error.
Separate draft edits from approved data. Give viewers, contributors, reviewers and publishers only the access they need. Back up authoritative datasets before bulk changes, record schema changes and keep a tested recovery procedure. Public maps should omit personal or sensitive location details unless there is a clear, lawful reason to publish them.
Run a representative pilot
Build a pilot around one real workflow rather than a showcase map. Use representative data, include the people who collect, review and use it, and define what success means before starting. The pilot should cover import, editing, analysis, publication, export and recovery from a common error.
Measure outcomes connected to the original problem. Examples include the proportion of complete required fields, the number of unresolved location errors, the time from field capture to approval, or the effort needed to produce a recurring map. Collect a baseline so later results have context. General guidance on outcome-focused delivery is available in the U.S. Digital Services Playbook and the NIST Guide to the Software Engineering Body of Knowledge.
Finish by recording limitations, support responsibilities and the conditions for wider use. If the pilot cannot preserve essential data, manage permissions or produce repeatable outputs, revise the workflow or test another option. A sound selection is one that staff can operate, audit and maintain with the data they actually have.