

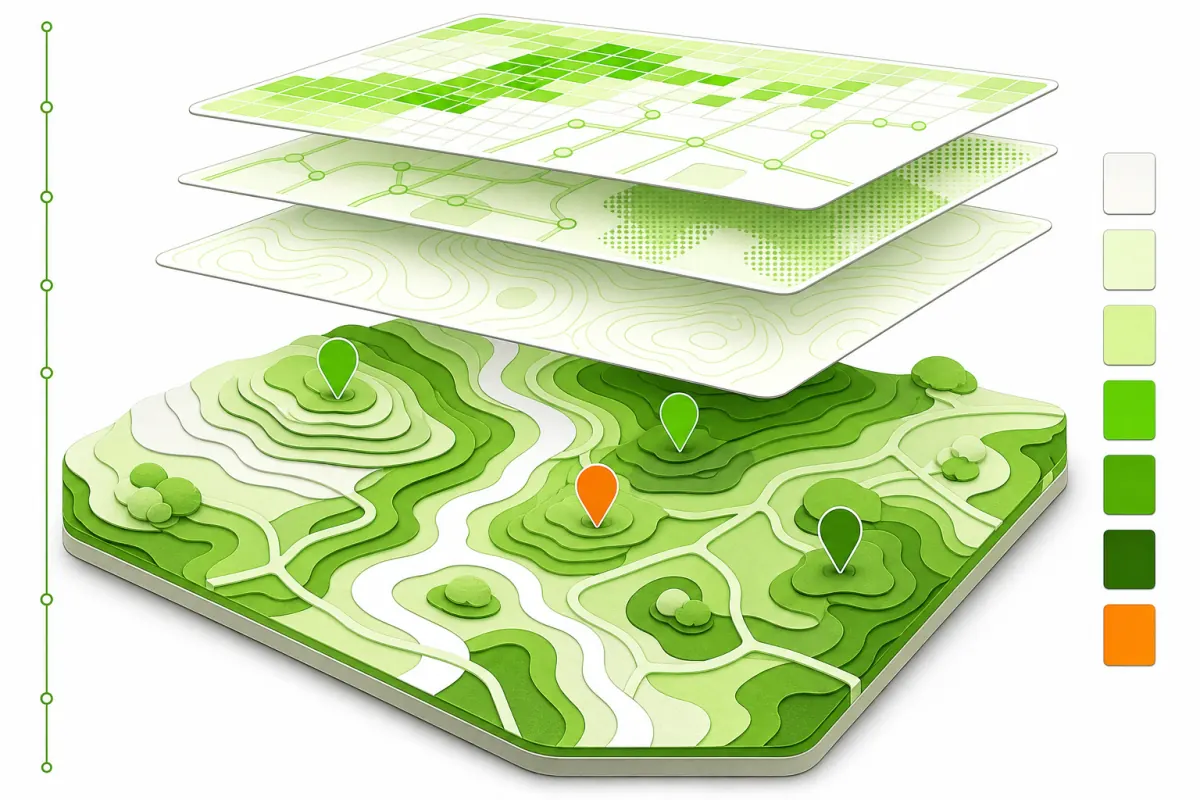
GIS mapping software connects location, attributes, and analysis in one project. The map is the visible result, but the workbench also has to manage layers, coordinate systems, tables, processing steps, and export formats. Choosing software begins with that workflow rather than with a long feature list.
Layer One: The Data You Need to See
GIS projects usually combine vector and raster data. Vector layers represent points, lines, and polygons with attached attributes. Raster layers organize values in a grid and are often used for imagery or continuous surfaces.
A useful application should let you inspect each layer’s source, fields, coordinate reference system, and display rules. Layer groups and clear names matter once a project contains more than a few sources.
GIS mapping software represents spatial information, manages multiple data sources, and connects geographic features with detailed attributes. These capabilities form the backbone of effective geographic data analysis and visualization. It allows users to transform raw geographic data into maps, showing features such as roads, rivers, or land parcels. Users can customize symbols, colors, and styles to differentiate between features or highlight specific aspects. Visualization tools often include support for points, lines, polygons, and raster images. They enable zooming, panning, and layering to focus on particular areas or data themes. Advanced visualizations may also incorporate 3D models and temporal data to show changes over time. Layer Management: Layer management organizes and controls spatial data within GIS applications.
Layer Two: Coordinate Reference Systems
Spatial data only aligns correctly when its coordinate reference system is known. Before analysis, confirm the CRS recorded for every input and choose an appropriate project CRS. A layer that appears in the wrong place may be mislabeled rather than damaged.
Reprojection is a deliberate data operation. Record the source and destination systems so the result can be understood and reproduced.
Each layer represents a dataset, such as a road network or zoning map, which can be toggled on or off to simplify map views. Users can reorder layers to control which data appears on top and adjust transparency for overlay analysis. Each row in a table represents a geographic feature, while columns store attributes like names, IDs, and other relevant data. This integration enables querying, sorting, and filtering data to extract meaningful patterns or generate reports. Some GIS applications allow editing attributes directly in the table or through connected forms. GIS mapping software relies on diverse data formats and interoperability protocols to ensure smooth data exchange and integration. Understanding these formats and standards is essential for handling spatial data accurately and efficiently.
Layer Three: Analysis Tools
Common vector operations include buffers, intersections, dissolves, joins, and selections by location. Raster workflows may classify values, calculate new surfaces, or combine grids. Network tools address connected paths and routes.
The important capability is not merely that an operation exists. The software should expose its inputs, parameters, output, and processing messages clearly. That makes it possible to check whether the geographic question and the chosen method actually match.
These methods help address different questions like proximity, connectivity, and data modeling by applying analytical tools to spatial layers. Buffer and Overlay Operations: Buffer operations create zones around geographic features at a specified distance. These are useful for impact assessments, such as determining areas within a certain distance of a river or road. Overlay operations combine two or more layers to produce a new layer. Common types include intersect, union, and difference, which reveal spatial coincidences or exclusions between sets of features. They support decision-making by highlighting spatial proximity and intersections important in planning and resource management. Network Analysis: Network analysis models connectivity and flow through linear features such as roads, pipelines, or rivers.
Layer Four: Formats and Interoperability
Projects often receive data from files, spatial databases, and web services. Common inputs include GeoJSON, GeoPackage, shapefiles, tabular coordinates, and raster imagery. Open standards can help different systems exchange maps and geographic features.
Format choice affects field names, geometry support, coordinate information, and portability. Test an import and export with representative data before making one format the project default.
Common GIS File Types: GIS software uses standard file types to store spatial and attribute data. Shapefiles (. shp) remain widely supported for vector data, consisting of multiple associated files that together describe geometry and attributes. GeoJSON is popular for web applications, offering a lightweight, text-based format that easily integrates with JavaScript. Rasters commonly use formats like GeoTIFF, which embeds geographic metadata within the image file. Other raster formats include JPEG2000 and Esri GRID for specialized use cases. Data Import and Export Workflows: Importing and exporting data smoothly is critical for GIS projects involving multiple sources. Georeferencing non-spatial data, such as spreadsheets containing coordinate columns, is supported by most modern GIS applications. Support for Open Standards: Open standards like those from the Open Geospatial Consortium (OGC) facilitate interoperability across different GIS platforms.
Layer Five: Repeatable Work
Batch processing, graphical models, and scripts can turn repeated manual steps into a documented procedure. Python support and plugin systems extend many desktop GIS applications, but automation should begin only after the manual workflow is understood.
Keep inputs separate from derived outputs. Use clear filenames, record parameters, and save processing logs where they can be reviewed. Reproducibility is a project habit, not a button.
GIS mapping software offers ways to adapt tools and workflows to specific project needs. Users can leverage scripting, modular extensions, and automated batch processes to increase efficiency and tailor functionality. Scripting with Python: Python scripting is a core feature in many GIS platforms. Through Python APIs, users can control map rendering, data manipulation, and analysis functions. Scripts can be written and tested within integrated development environments or directly in the GIS software’s console. Plugin Architecture: The plugin system enables users to extend GIS software functionality without altering core source code. Developers create and distribute plugins to address specific needs such as custom symbology or integration with external databases. Users install plugins via built-in managers or manually add them to the software environment.
Layer Six: Sharing the Result
A map may be delivered as a print layout, an image, a data package, or an interactive web map. The destination changes the design. Printed maps need a deliberate page size and legible labels; web maps need suitable data volume, interaction, and accessibility.
Collaboration also requires agreement about data ownership, update procedures, and the project’s folder structure. A shared file without its sources and fonts may not reproduce the intended map.
GIS mapping software enhances teamwork by enabling users to publish maps online and maintain synchronized datasets. These functions improve accessibility and data reliability for projects involving multiple stakeholders. Web-Based Map Publishing: Web-based map publishing allows users to create and share interactive maps through browsers. Technologies such as APIs, database triggers, and cloud services facilitate instant data delivery. These applications demonstrate how spatial data supports decision-making, resource management, and crisis response. Urban Planning: In urban planning, GIS tools enable analysis of zoning, infrastructure, and population density. City planners use these maps to visualize growth areas and plan utilities efficiently. GIS also supports land use suitability assessments by considering factors like flood risk, soil quality, and existing infrastructure.
Plot a Small Evaluation Route
Open a representative vector layer and raster layer. Verify their coordinate reference systems and alignment. Join an attribute table and run one spatial operation. Style the result and create a simple layout. Export both the map and an interoperable data package. Repeat one step with a batch tool or saved model.
This route tests the complete journey from source data to a shareable result. The right GIS workbench is the one that makes every layer of that journey visible, checkable, and repeatable.
When evaluating GIS mapping software, consider the types of spatial data you work with and the analysis techniques required for your projects. Assess support for standard data formats and open interoperability protocols to ensure compatibility with existing datasets. Examine integration capabilities for external data sources and collaborative features for sharing maps with stakeholders. Prioritize usability and performance to ensure efficient project delivery and effective spatial analysis. Processing Speed: Readers often ask how to choose GIS mapping software that can efficiently handle their data and analysis needs. Processing speed is a key factor, especially when working with large datasets or complex spatial analyses.